EVALUATION OF SPECIFIC ABSORPTION RATE AMONG PATIENTS USING 3 TESLA AND 1.5 TESLA MAGNETIC RESONANCE IMAGING MACHINES
DOI:
https://doi.org/10.55374/jseamed.v4i1.54Keywords:
1.5 Tesla MRI machine, 3 Tesla MRI machine, Specific Absorption Rate (SAR)Abstract
Background: Specific Absorption Rate (SAR) is radiofrequency power delivered to tissue duringa Magnetic Resonance Imaging (MRI) examination, expressed as watts per kg (W/kg). Radiofrequencypower deposition results in increased heating of patient tissues; thus, the use of MRI has to becontrolled to ensure patient safety.
Objective: The study aimed to evaluate SAR among patients using the 3 Tesla MRI (MRI 3T) and 1.5Tesla MRI (MRI 1.5T) machines.
Methods: Data were obtained from patients who were examined using MRI 3T (1,159 patients, 8,225series) and MRI 1.5T (1,423 patients, 8,605 series) machines. Age, body weight, SAR, repetition time(TR), type of radiofrequency (RF) pulse and anatomical region exposed were studied.
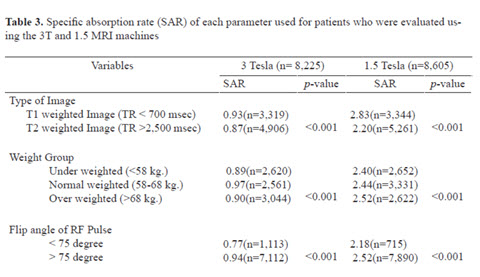
Results: Average SAR for all patients using the MRI 3T was lower than that of the MR 1.5T in everypart (p <0.001) = 0.92 ± 0.57 W/Kg, 2.45 ± 1.01 W/Kg, accordingly. The SAR that the patients receivedusing the spin echo technique revealed that T2 weighted image had lower SAR than T1 weighted imagefrom both MRI 3T and MRI 1.5T (p < 0.001), 0.87 and 0.98 W/kg for MRI 3T, 2.20 and 2.83 W/kg forMRI 1.5T, respectively. For underweight patients, the lowest SAR was 0.89 W/Kg (MRI 3T) and 2.40W/Kg (MRI 1.5T), respectively. Whereas, among overweight patients, the SAR was the highest at 0.97W/Kg (MRI 3T) and 2.52 W/Kg (MRI 1.5T). For SAR categorized by the flip angle of the RF pulse,and patients evaluated by the MRI 3T, the study revealed that the group with the flip angle of the RFpulse <75 degrees had lower SAR than the flip angle of the RF pulse >75 degrees, 0.77 W/Kg and 0.94W/Kg, accordingly (p < 0.001) similar to the MRI 1.5T.
Conclusion: The average SAR of patients evaluated using the MRI 3T was lower than those of patientsevaluated using the MRI 1.5T in every body part examined. SAR was lower when the TR was increasedand flip angle was decreased.
Downloads
Metrics
References
Saiviroonporn P. MRI: Principle and Safety. Bangkok. Wattana Printing Factory. 2008.
National Council on Radiation Protection and Measurements. Biological effects and exposure criteria for radiofrequency electromagnetic fields. Report No. 86. Bethesda, MD: National Council on Radiation Protection and Measurements; 1986.
Gordon CJ. Thermal physiology. In: Biological effects of radiofrequency radiation. Washington, DC:EPA-600/8-83-0264A; 1984.
Gordon CJ. Effect of Radiofrequency radiation exposure on thermo-regulation. ISI Atlas Sci Plants Anim 1988; 1: 245-50.
Michaelson SM, Lin JC. Biological effects and health implications of radiofrequency radiation. New York: Plenum 1987. DOI: https://doi.org/10.1007/978-1-4757-4614-3
Adey WR. Tissue interactions with nonionizing electromagnetic fields. Physiol Rev 1981; 61: 435-514. DOI: https://doi.org/10.1152/physrev.1981.61.2.435
Elder JA. Special senses. In: biological effects of radiofrequency radiation. Washington, DC: EPA-600/8-83-26A;1984.
Berman E. Reproductive effects. In: biological effects of radiofrequency radiation. Washington, DC:EPA-600/8-83-026A;1984.
U.S. Environmental Protection Agency. Evaluation of potential electromagnetic carcinogenicity. Office of Health and Environmental Assessment. Washington, DC:EPA-600/6-90-005A;1990.
Conner ME. Mammalian teratogenesis and radio-frequency fields. Proc IEEE 1980; 68: 56-60. DOI: https://doi.org/10.1109/PROC.1980.11581
Lary JM, Conover DL. Teratogenic effects of radiofrequency radiation. IEEE Eng Med Biol 1987; 44: 42-6. DOI: https://doi.org/10.1109/MEMB.1987.5006374
Edelman RR, Shellock FG, Ahladis J. Practical MRI for the technologist and imaging specialist. In: Edelman RR, Hesselink J, eds. Clinical magnetic resonance. Philandelphia: WB Saunders 1990.
Persson BRR, Stahlberg F. Health and safety of clinical NMR examinations. Boca Raton, FL: CRC Press 1989: 59-79.
Shellock FG, Kanal E. Magnetic Resonance: bioeffects, safety, and patient management, 2nd ed. New York: Lippincott-Raven 1996: 25-48.
Shellock FG. Biological effects and safety aspects of magnetic resonance imaging. Magn Reson Q 1989; 5: 243-61
Kanal E, Shellock FG, Talagala L. Safety considerations in MR imaging. Radiology 1990; 176: 593-606. DOI: https://doi.org/10.1148/radiology.176.3.2202008
Morvan D, Leroy-Willig A, Jehenson P, Cuenod CA, Syrota A. Temperature changes induced in human muscle by rsiofrequency H01 coplinf: measurement with an MR imaging diffusion technique. Radiology. 1992; 185: 871-4. DOI: https://doi.org/10.1148/radiology.185.3.1438778
Shellock FG. MRI bioeffects and safety. In: Atlas S, ed. Magnetic resonance imaging of the brain and spine. New York: Raven Press 1990.
Shellock FG. Thermal responses in human subjects exposed to magnetic resonance imaging. Ann NY Acad Sci 1992: 260-72. DOI: https://doi.org/10.1111/j.1749-6632.1992.tb49615.x
Bottomley PA, Edelstein WA. Power deposition in whole body NMR imaging. Med Phys 1981; 8: 510-2. DOI: https://doi.org/10.1118/1.595000
Shellock FG, Liwer C, Kanal E. MRI bioeffects, safety, and patient management: a review. Rev Magn Reson Imaging 1992; 4: 21-63.
Beers J. Biological effects of weak electromagnetic fields from 0 Hz to 200 MHz: a survey of the literature with special emphasis on possible magnetic resonance effects. Magn Reson Imaging 1989; 7: 309-31. DOI: https://doi.org/10.1016/0730-725X(89)90556-0
United States Food and Drug Administration. Criteria for significant risk investigations of Magnetic Resonance diagnostic devices. 2003, at URL http//www.fda.gov/cdrh /ode/ guidance/793.pdf.
National Electronics and Computer Techno logy Center. SizeThailand. [online] 2018 [cited 2019 Jan 8] Available from: URL: http:// www.sizethailand.org/region_all.html
Kang O, Skalski M. MRI Sequence Parameters. [online] 2018 [cited 2019 April 8] Available from: URL: https://radiopaedia. org/articles/mri-sequence-parameters.
Krishnamurthy U, Neelavalli J, Mody S, Yeo L, Jella PK, Saleem S, et al. MR imaging of the fetal strengths: comparing specific absorption rate (SAR) and image quality. J Perinat Med [online] 2018 [cited 2019 May8] Available from: URL: https://www.ncbi. nlm.nih. gov/ pmc/ articles/PMC5987203/#
Allison J, Yanasak N. What MRI sequence produce the highest specific absorption rate, and is there something we should be doing to reduce the SAR during standard examinations? Am J Roentgenol 2015; 205:W140. DOI: https://doi.org/10.2214/AJR.14.14173
Chavhan GB, Babyn PS, Singh M, Vidarsson L, Shroff M. MR Imaging at 3.0 T in children; technical differences, safety issues, and initial experience. Radiographics 2009; 29: 1453. DOI: https://doi.org/10.1148/rg.295095041
Gach HM, Mackey SL, Hausman SE, Danielle R J, Benzinger TL, Henke L, et al. MRI safety risks in the obese: The case of the disposable lighter stored in the pannus. Radiol Case Rep 2019; 14: 634–8. DOI: https://doi.org/10.1016/j.radcr.2019.02.023
Downloads
Published
How to Cite
Issue
Section
License
The Journal of Southeast Asian Medical Research will hold the copyright to all published articles. The publisher's production department handles copyright forms once a manuscript is accepted and scheduled for publication.